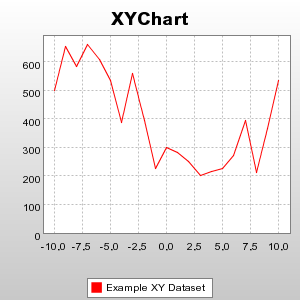
 I recently had an opportunity to use the Cewolf 1.0 at work for some Time Series plots (a variant of the XY Chart, shown in the figure above, where the X-axis is for time values). This blog is about Cewolf and how to create time series plots with it.
Cewolf is a JSP tag library which uses JFreeChart for rendering the charts. It comes with a controller servlet which is used for interpreting the parameters passed through the JSP tag and accordingly generating the chart image in-memory (no files created on the file system of the server) and embeds the image as
IMO, Cewolf/JFreeChart is the best free charting package for a web application required to draw charts and being developed in Java EE. It supports several different types of charts and one of them was the Time Series plots. Here is some code which can produce a simple time series plot (using cewolf).
1. To install Cewolf you just need to copy the jars from its lib/ path (which includes the JFreeChart jar too) to WEB-INF/lib of your web application.
2. We need to write a data producer which gets the data set (in {time, value} pairs for the time series plot). A typical time series data producer is given below:
//~--- non-JDK imports --------------------------------------------------------

import de.laures.cewolf.DatasetProduceException;
import de.laures.cewolf.DatasetProducer;

import org.jfree.data.time.Minute;
import org.jfree.data.time.TimeSeries;
import org.jfree.data.time.TimeSeriesCollection;

//~--- JDK imports ------------------------------------------------------------

import java.io.Serializable;

import java.util.Date;
import java.util.Map;

/**
 * A sample data producer for the time series plot.
*/
public class MyDataProducer implements DatasetProducer, Serializable
{
    public MyDataProducer()
    {
    }

    public Object produceDataset(Map map) throws DatasetProduceException
    {
        /*
         *   To this time series collection we can add more than one time series
         *   where each time series will be represented by its own line on a
         *   plot.
         */
        TimeSeriesCollection ts = new TimeSeriesCollection();

        try {
            String[] allSeries = { "series1", "series2" };

            // Loop through all series and add the data to series and series to
            // timeseries collection (ts).
            for (int i = 0; i < allSeries.length; i++) {

                // Get data for series from some kind of datasource
                MyDataSet[] myDataSet = GetDataForSeries(allSeries[i]);
                TimeSeries  mySeries  = new TimeSeries("My Data Series " + i, Minute.class);

                // Add data to series
                for (MyDataSet data : myDataSet) {
                    mySeries.add(new Minute(new Date(data.getTimestamp().getTime())), data.getYValue());
                }

                // Add the series to the collection
                ts.addSeries(mySeries);
            }
        } catch (Exception e) {
            e.printStackTrace();

            throw new DatasetProduceException();
        }

        return ts;
    }

    public boolean hasExpired(Map map, Date date)
    {
        return false;
    }

    public String getProducerId()
    {
        return "My Data Producer";
    }

    private MyDataSet[] GetDataForSeries(String string)
    {
        // Get data from DB or some data source
        // return an array of time/value pairs (for instance, as an array
        // of MyDataSet instances.
    }
}
MyDataSet class is:
import java.sql.Timestamp;

/** A sample time/value pair data. An array/list of this type will constitute
 * the data set for the plot.
*/
public class MyDataSet
{
    private Timestamp timestamp; // You can use other date/time types in Java SE here.
    private double    yValue;

    public MyDataSet()
    {
    }

    public Timestamp getTimestamp() {
        return timestamp;
    }

    public void setTimestamp(Timestamp timestamp) {
        this.timestamp = timestamp;
    }

    public double getYValue() {
        return yValue;
    }

    public void setYValue(double yValue) {
        this.yValue = yValue;
    }
}
In the JSP page you include the chart now:
<jsp:usebean id="myPlotData" class="com.mycompany.MyDataProducer">

<cewolf:chart
    id="MyChart"
    type="timeseries"
    title="My Plot Title"
    xaxislabel="Time"
    yaxislabel="My Data Value">
    <cewolf:data>
    <cewolf:producer id="myPlotData" usecache="false">
    </cewolf:data>
</cewolf:chart>
<cewolf:img chartid="MyChart" renderer="/cewolf" width="1000" height="400">
Lastly, one needs to configure the CewolfServlet in the web.xml:
<servlet>
   <servlet-name>CewolfServlet</servlet-name>
   <servlet-class>de.laures.cewolf.CewolfRenderer</servlet-class>
</servlet>

<servlet-mapping>
   <servlet-name>CewolfServlet</servlet-name>
 <url-pattern>/cewolf/*</url-pattern>
</servlet-mapping>
The generated charts on tomcat does require one to increase the JVM heap size to at least 256MB from the default 64MB.
The pros of using Cewolf/JFreeChart in a Java EE web application:
1. Compared to the other open source packages, JFreeChart happens to be the best in terms of the look and feel of the plots and the ease of use of the API.
2. Cewolf contributes to the glory by making the JFreeChart available as JSP tag library. And as far as i know, there isn't any other better option for plotting in the open source Java world.
The duo of Cewolf/JFreeChart are lacking in a few important features:
1. AJAX support for real-time plots. So if we want the server to be able to asynchronously (or by the virtue of some background polling from client) refresh the chart in (near) real-time then its not something supported today in Cewolf/JFreeChart. If this feature is required then JViews Charts or Chart Director are the two commercial offerings that i know of that can do AJAX based live charts.
2. Zoom and Pan interactions are not easily supported by the API.
3 comments:
Gauche! You lack conitnuity man.
Hello,
Is there a way to pass data to the constructor of the DataProducer Class, how do we pass parameters to teh consturctor from a JSP?
We can't pass any parameter to the constructor of the DataProducer Class. But we can pass the parameters map to the method which is producing Dataset object (public Object produceDataset(Map params))
On the JSP page you mast use cewolf:param tag inside cewolf:producer tag with attributes name (indicate the key in passed to the method map) and value (indicate the value in map).
In method produceDataset you can get parameter by name (the same as value of name attribute in cewolf:param tag) from map.
Post a Comment